Demonstrators circle the U.S. Bank Plaza in Minneapolis on April 8, 2020, to call for a suspension of rent and mortgage during the COVID-19 pandemic. Photo by Max Nesterak/minnesotadigest.com.
Minnesota has long touted housing affordability in its efforts to recruit and retain people and industry. Although it still largely holds up, it’s uneven depending on where you live and how much money you make, according to a Reformer analysis of income and housing costs.
For a long time, a rule of thumb for homebuyers was that the total price of your home shouldn’t be more than 2.5 times your annual income, but even in the 1980s buyers were ignoring the rule, and the national average price-to-income ratio hovered around 3.1, according to Harvard’s Joint Center for Housing Studies.
And in recent decades, as the price of homes skyrocketed while wages languished, the disconnect between the two has grown ever larger. Today, according to that same Harvard study, the national home price-to-income ratio stands at 5.3. And in some big metros it’s much higher – across much of California, for instance, the typical home now costs well in excess of 10 times the typical family’s income.
Here in Minnesota, by contrast, homes are considerably more affordable. Our statewide price-to-income ratio hovered a little bit above 4.0 in 2021, according to a minnesotadigest.com analysis of data from the National Association of Realtors and the U.S. Census Bureau. That’s led to a homeownership rate of just over 74% – the eighth highest in the nation, according to Census data.
In some places in the western half of the state, in fact, the median home on the market still costs less than 2.5 times the median family’s income.
In Kittson County, in the far northwestern corner of the state, for instance, the median sales price in 2021 was $103,000 while the typical family had an income of $55,000. The resulting price-to-income ratio of 1.86 is the lowest in the state. Lac Qui Parle and Traverse counties, on the South Dakota border, were the only other places with ratios below 2.
The ratio in Hennepin and Ramsey counties, by contrast, stood at around 4.5, a reflection of the relatively high prices in the Twin Cities region. That’s in the same ballpark as other similarly sized midwestern metros, like Chicago (4.4) and Detroit (3.3). But affordability in the Twin Cities is considerably better than in peer metros on the coasts, like New York City (7.1), Washington, D.C., (8.4) and Boston (9.6).
In Minnesota, the biggest disconnect between affordability and income happens in Cook County, in the extreme northeastern corner of the state. There the typical home is nearly five times the median household income. The county’s economy is heavily reliant on tourism, which means relatively low wages coupled with housing shortages driven by a large number of vacation and rental homes.
“We see that a lot in areas that rely heavily on tourism and service industry jobs,” said Andrew Aurand, vice president for research at the National Low Income Housing Coalition. “It’s a significant problem in that the housing stock is not really serving those workers.”
Similar dynamics are also likely at play in Minnesota’s lake country, in places like Cass, Hubbard and Crow Wing counties, which also stand out on the map.
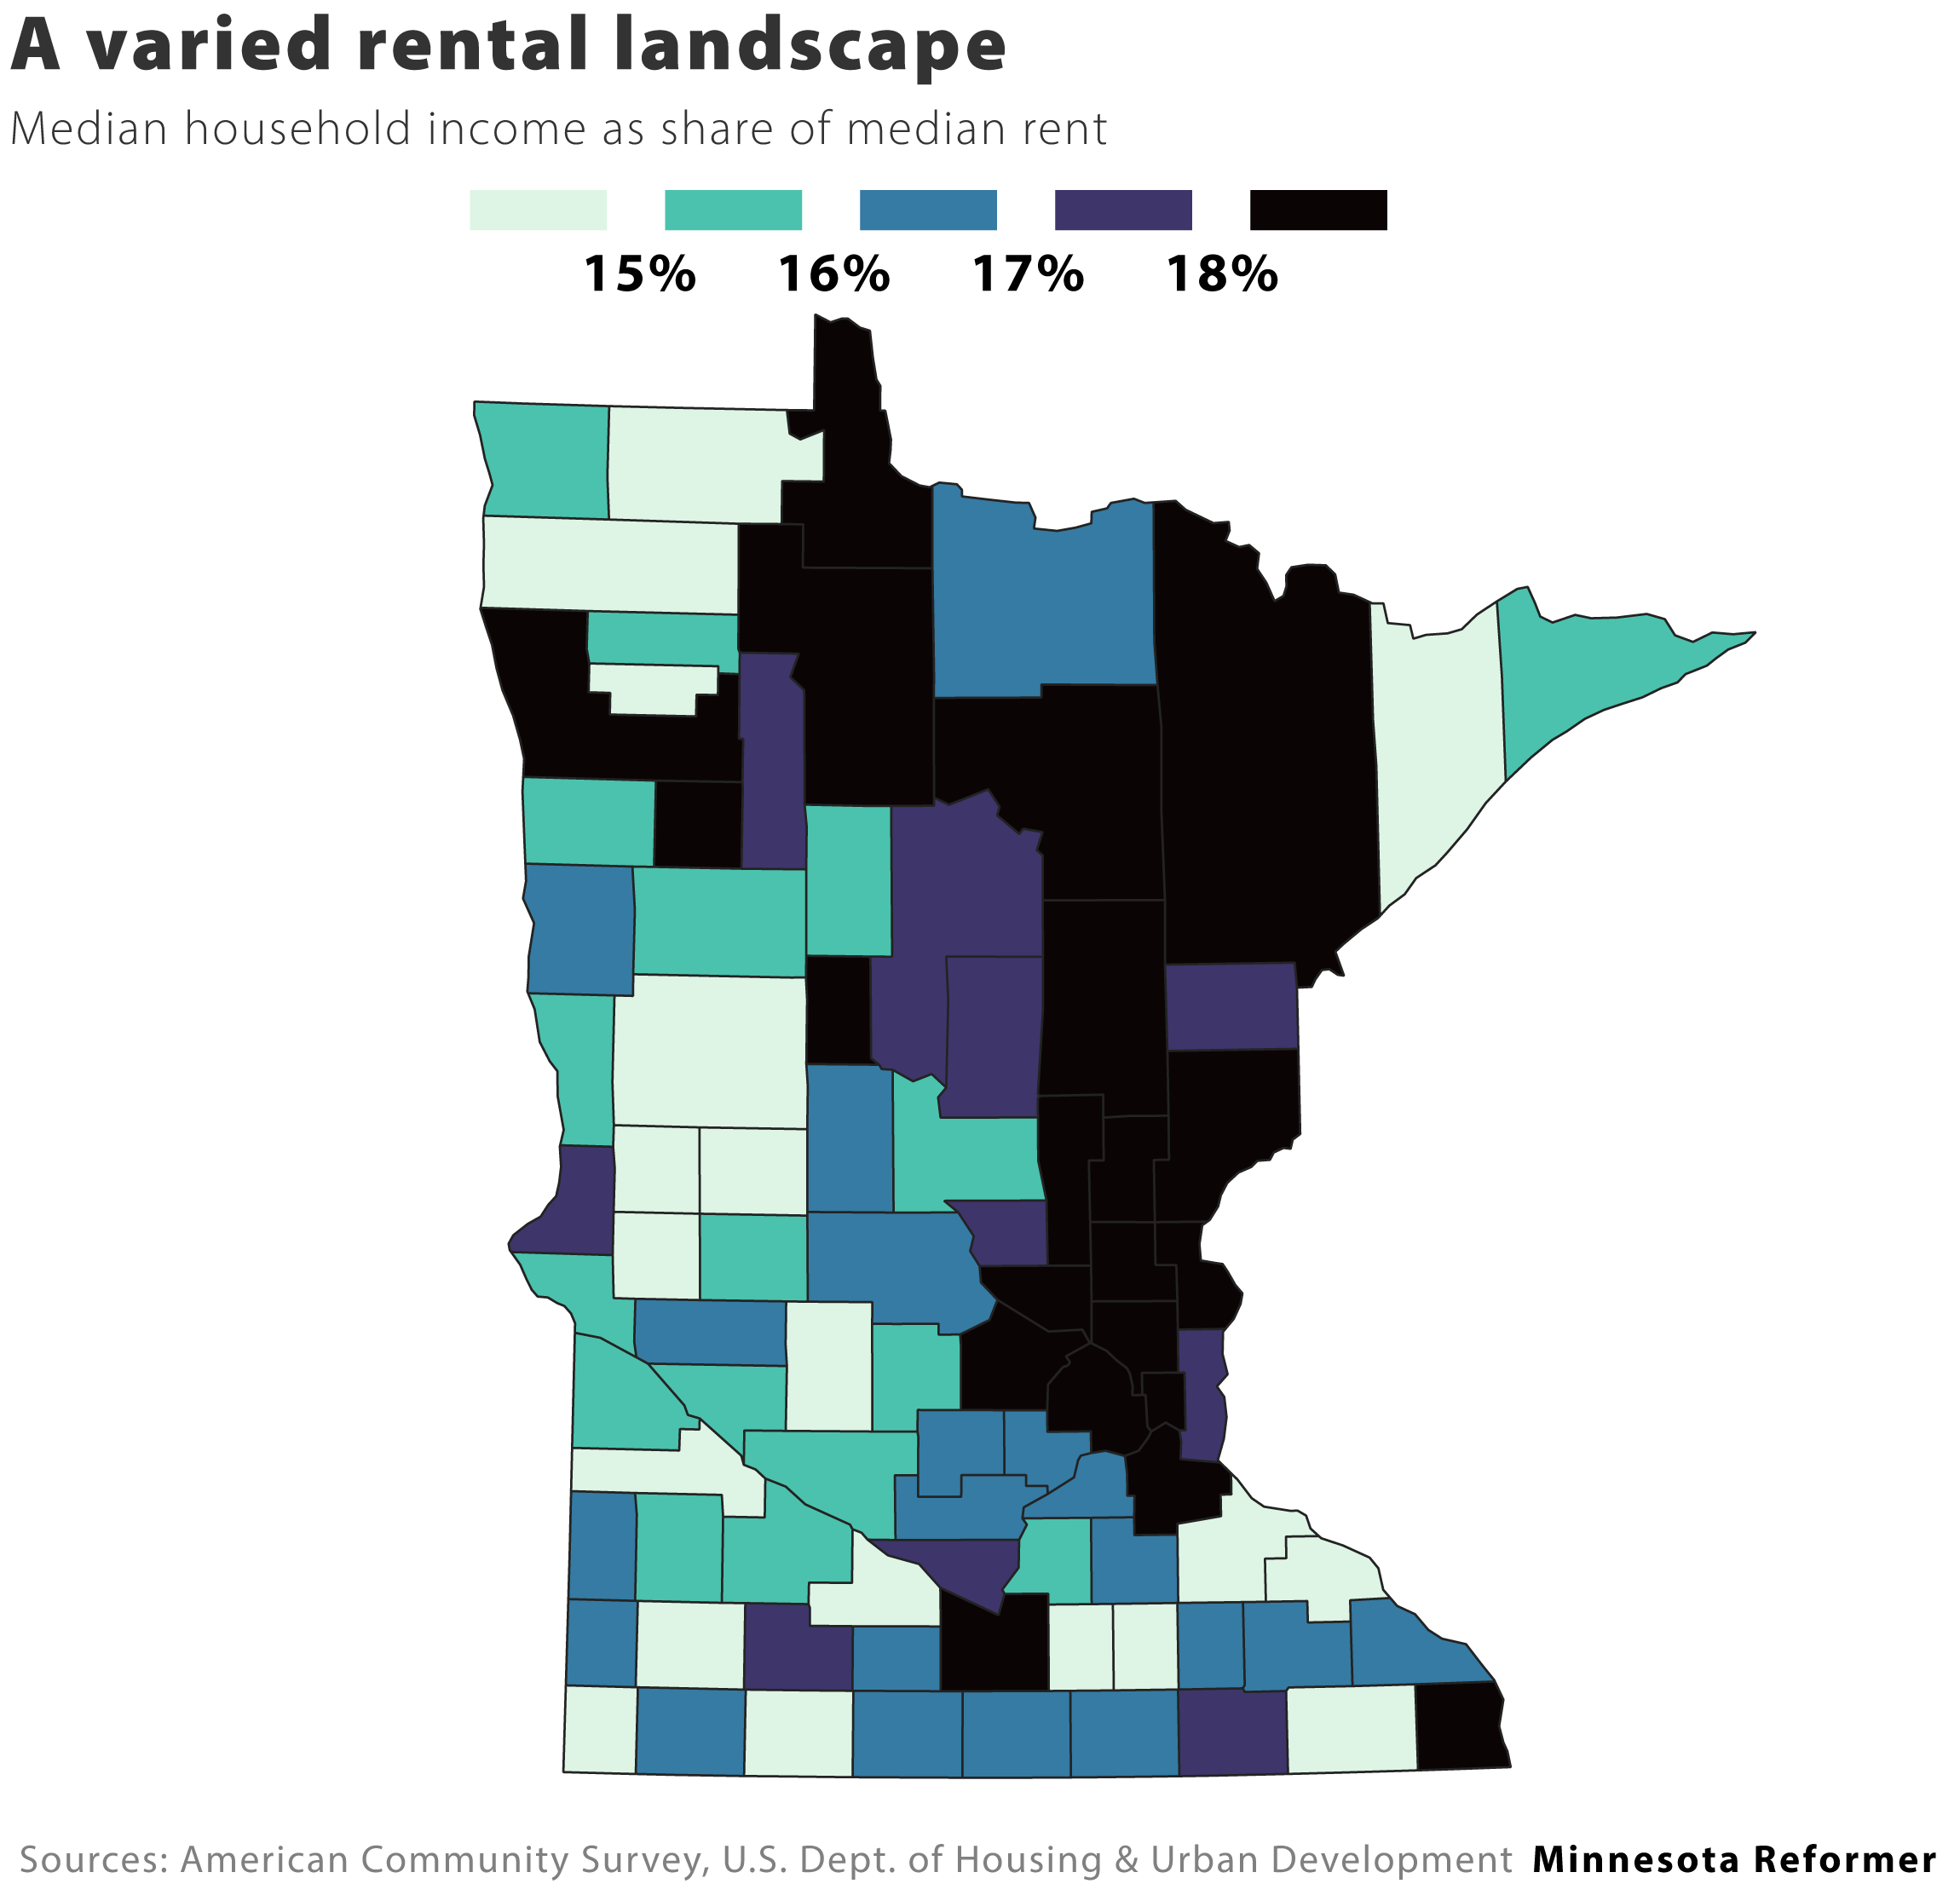
On rental affordability, the statewide picture is somewhat different. The Reformer ran an analysis using median rent data from the Department of Housing and Urban Development. The traditional guideline for rental affordability is that families should spend no more than 30% of their income on housing. Only Ramsey County, where the median family income is 25% of the median rent, approaches this threshold in Minnesota. Just across the river in Hennepin County, the ratio is closer to 20%.

It’s worth noting, however, that renters typically earn less than homeowners, so these numbers would look worse if the Census income data only included rental households.
Again, prices are generally more affordable in the western half of the state. Stevens County, near the South Dakota border, lays claim to the most affordable rents, coming in at less than 14% of the typical family’s income.
There is some squishiness to all of these estimates, particularly during a time of rapidly rising prices. The home price and rental data comes from 2021, and costs have risen since then. The income data, meanwhile, comes from the Census’ American Community Survey, which currently goes through 2020. The pandemic and its immediate aftermath have disrupted housing, employment and migration patterns across the state, and it’s possible that in a few years the relative pictures may look different.
These figures also reflect, to the best extent possible, the experience of the median or typical household in each county. Low-income families often struggle with housing costs regardless of how well the middle class is doing. The Minnesota Housing Partnership, for instance, estimates that roughly one quarter of Minnesota families are paying more than 30% of their income for housing.
The post Where housing is most (and least) affordable in Minnesota appeared first on minnesotadigest.com.
